Interlude show: Memory Wall research
Main takeaways
Shrinking a wire raises its resistance and leaves its capacitance per millimetre unchanged: it gets thinner, but it also sits closer to its neighbours, and the two effects cancel. Memory sits millimetres to centimetres away, and supply voltage stopped falling around 2005. So the energy to move a bit, ½·C·V2, stopped falling while arithmetic kept getting cheaper. That is the memory wall.
- Arithmetic rode the shrink; data movement didn't. A transistor's capacitance shrinks with it, so every switch costs less. Energy per gate switch fell 104–105× since 1980, yet a DRAM fetch still costs about 64,000× a 32-bit add.
- Resistance goes up. Resistance per mm grows as the square of the shrink, so wires fall behind the gates they connect. Long wires need a repeater every few tens of microns, and signals crawl across a chip at about c/120.
- Capacitance per mm stays flat, and that is the balancing act. A thinner wire has less facing area, but it sits closer to its neighbours. The two cancel, leaving about 0.2 fF/µm in every process since the 1980s. Only a better insulator could help, and low-k dielectrics stalled around 2011.
- Distance and voltage didn't shrink either. Dies, packages and DIMMs kept their size. Voltage froze at about 0.75–0.85 V once Dennard scaling ended (~2005), pinned by the 60 mV-per-decade subthreshold slope. So energy per bit per mm has sat at 0.05–0.1 pJ for 20 years.
- DRAM has its own latency floor. A bit is a 10–20 fF charge sensed against a bitline, an RC process driven by a ~3 V wordline. The row cycle has been stuck at 45–50 ns for two decades, and a miss now costs 300–500 CPU cycles.
- Every fix shortens the wire or moves fewer bits. The fixes so far: caches (from none to 8–10 tiers), and HBM on the package (15–20× less energy per bit than DDR3). Next come 3D stacking (0.1–0.5 pJ/bit) and, later, optics. Algorithms help by reusing data: tiling, quantization and IO-aware kernels.
Moving data costs up to 64,000× the arithmetic
Log scale; 32-bit operands. Source: Bill Dally, CACM, Sept 2022. Your on-air rule "an add = moving its inputs 10 µm" matches it.
Your questions, 8–13 Sep
Your 22 prompts, grouped into 16 questions. Tap one to open its answer; the question stays pinned while you read.
1 · The memory wall itself
Tue 8 Sep: from your Gemini explanation to a 60-year report.
Why has arithmetic improved so much faster than memory, in energy and in time?Tue 8 Sep · your first question
Because a transistor gets cheaper and faster when it shrinks, while a memory access is mostly long wires, and wires don't.
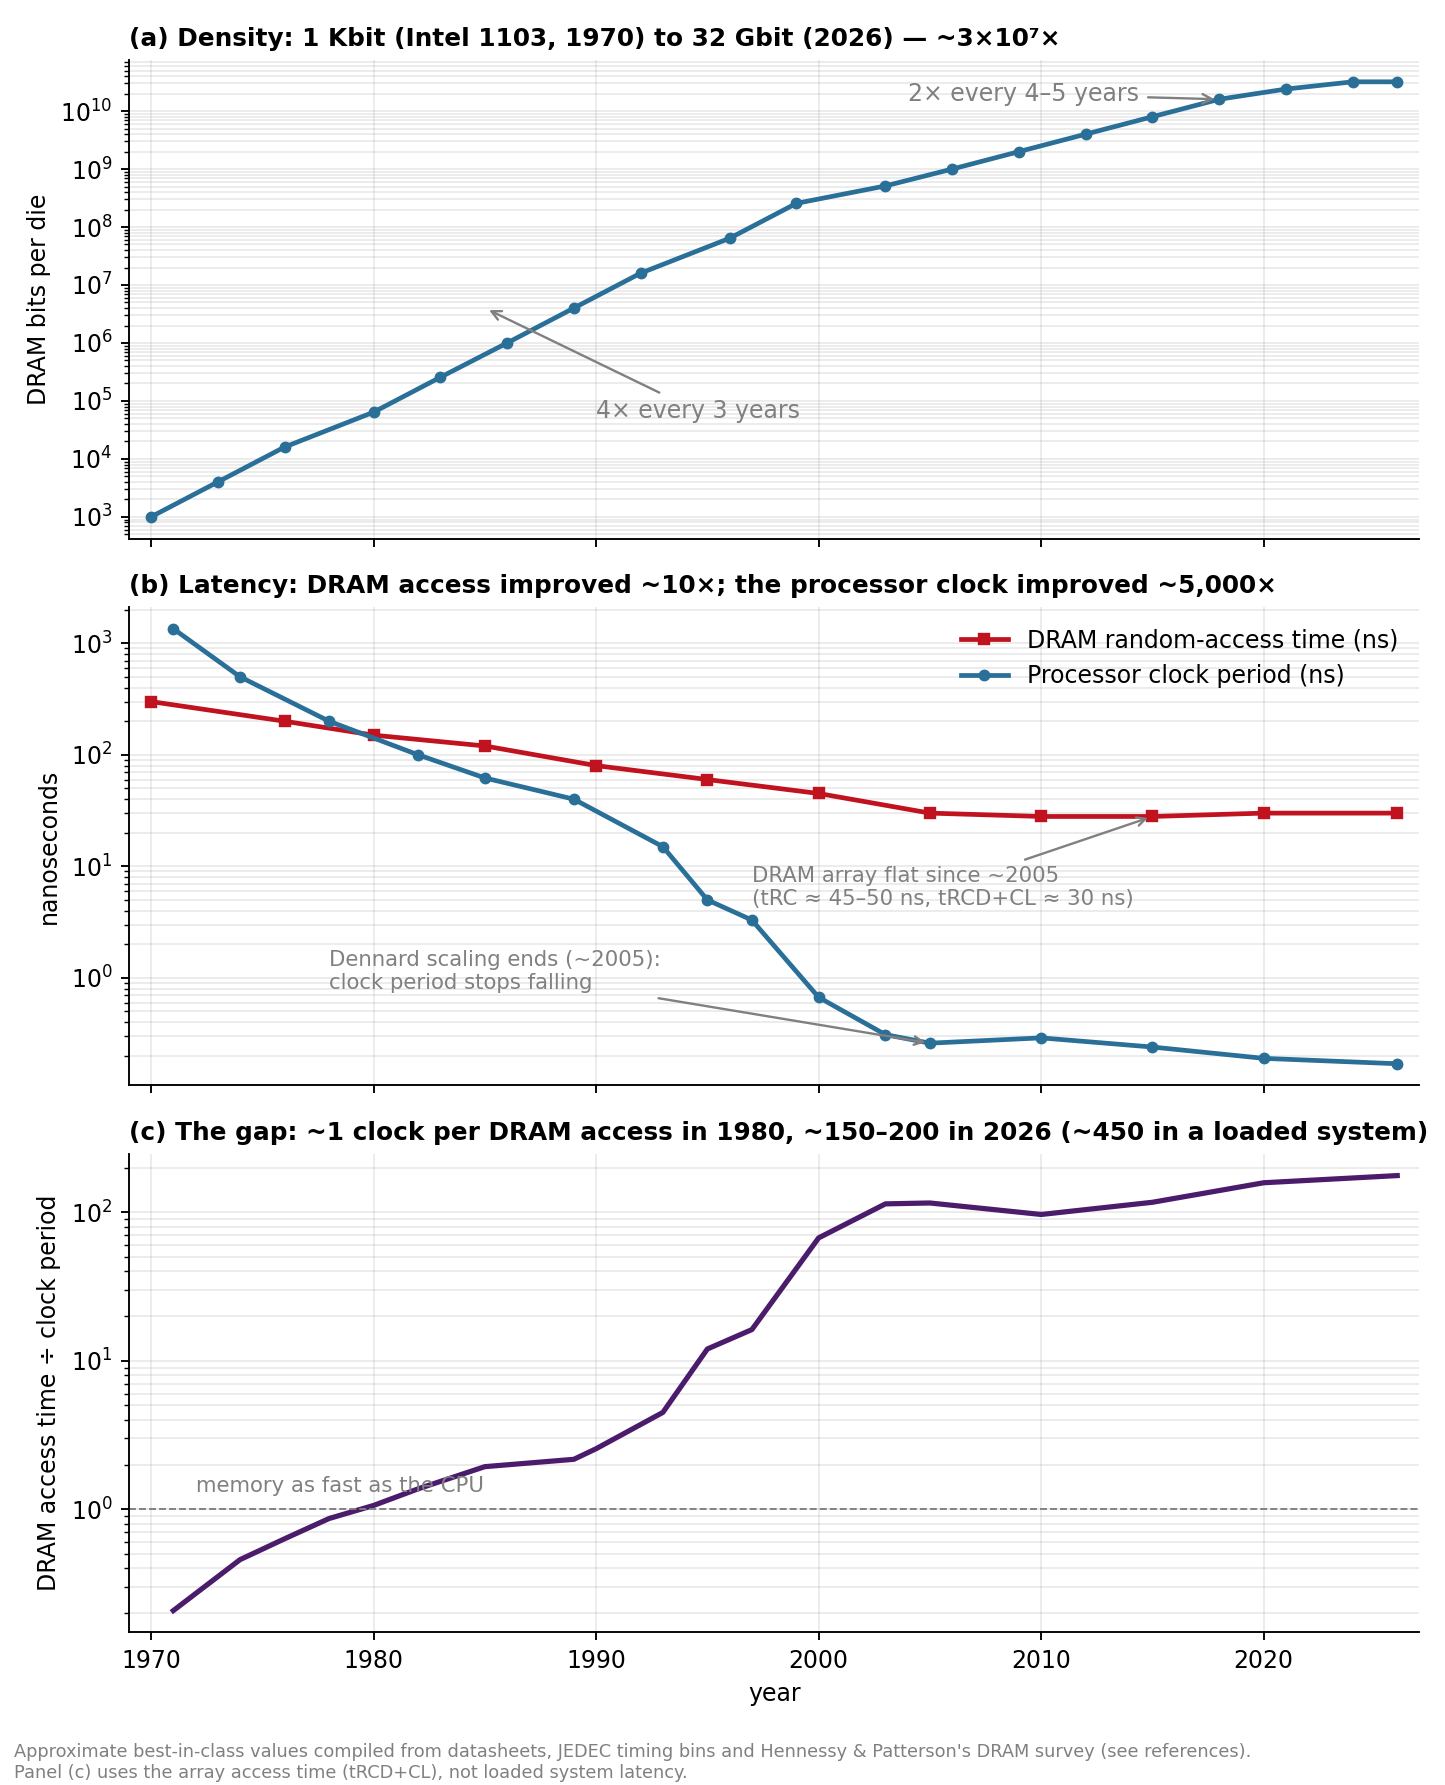
Memory got 30 million times denser but only 10 times faster
Log scale. Source: The Memory Wall report, Parts II and VII.
- Energy. Switching costs ½·C·V2. Until 2005, every shrink cut both C and V, so energy per switch fell as the cube of the shrink. A DRAM fetch is wordlines, bitlines, a bus across the die and a trace across the board. That wire's capacitance per mm is fixed and its length never shrank.
- Time. DRAM access went from 300 ns to 30 ns while the clock period went from 1,000 ns to 0.2 ns. A miss that cost one cycle in 1980 costs 300–500 now.
- The ratio keeps widening. A 64-bit DRAM read cost ~100× a 32-bit multiply in the mid-1980s and ~500× in 2014. In 2026 it is ~3,000× from DDR5, or 500–700× from HBM.
Is my "transistors shrink in 2D, wires in 1D" explanation from the show right?Tue 8 Sep · the Gemini "intuition pump" you pasted
It points the right way but is incomplete. The energy to move a bit is (energy per mm) × (mm travelled), and both factors stopped improving.
c is fixed by the wire's shape: ~0.2 fF/µm. V has been stuck at ~0.75–0.85 V since ~2005.
Set by the die (~800 mm² reticle), the package and the board (a DIMM is ~13 cm). None of them shrank.
- What 2D/1D gets right: bits fill an area while wires cross a length. So the cost of a random access grows as √(memory size).
- Correction 1: the voltage floor comes from the 60 mV-per-decade subthreshold slope, not from thermal noise. Five decades of on/off ratio plus speed needs ~0.6–0.75 V.
- Correction 2: the DRAM cell is its own wall. Charge sensing and a ~3 V wordline set its latency, and wire physics alone doesn't explain that.
- Detail: ruthenium is the liner and, increasingly, a barrier-free conductor; tantalum nitride is the barrier it replaces.
Why does capacitance per mm stay fixed?Tue 8 Sep
Capacitance depends on the shape of the conductors, not their size. A shrink keeps the shape, so capacitance per mm stays put, while resistance per mm climbs.
- Why they cancel: capacitance per length ≈ ε × (height ÷ spacing). The wire's facing area shrinks, but so does the gap to its neighbour. Capacitance scales with linear size (a sphere's grows with its radius), so per unit length it depends only on shape.
- The only knob is ε, the insulator. Its k went from 3.9 toward ~2.5, then stuck around 2011, when porous films became too fragile to manufacture.
- Resistance has no such luck: resistance per mm is ρ ÷ (width × height), so it rises as the square of the shrink. Below ~12 nm, copper's resistivity itself climbs 4–6×.
- Short local wires shrink in length too, so they get cheaper. A wire that must cross a die or a board keeps its length, and with it its capacitance.
What is capacitance, and why is it relevant to the memory wall?Tue 8 Sep
Capacitance is how much charge a structure must hold to sit at a given voltage (C = Q/V). Sending a 1 means pushing that charge onto a wire, which costs time (≈ R·C) and energy (≈ ½·C·V2), however clever the circuit.
A 1-mm wire has a thousand transistor gates' worth of capacitance
Log scale, order of magnitude. Source: the 8 Sep chat and the report, Part III.
- A transistor's capacitance shrinks with it, which is why arithmetic got thousands of times cheaper. A wire's capacitance grows with its length.
- In DRAM the bit is a charge. A 10–20 fF cell is read by sharing its charge with the bitline. That step is an RC process no transistor shrink speeds up, so it sets the latency floor.
What happened over 60 years of memory scaling, as we went from no caches to lots of them?Tue 8 Sep · the report you asked for
Capacity scaled spectacularly and speed did not. Each time the gap grew about 5×, another cache level appeared.
One more level every time the gap grows ~5×
Rule of thumb from the report: levels ≈ log(gap) ÷ log(5), where the gap is DRAM access time ÷ clock period.
Sixty years in twelve steps
- 1965Wilkes proposes "slave memories", the idea of a cache.
- 1966–68Dennard invents the one-transistor DRAM cell at IBM.
- 1968IBM S/360-85 ships the first commercial cache, 80 ns against ~1 µs core.
- 1970Intel 1103: 1 Kbit of DRAM at ~300 ns. It kills core memory.
- 1974The Dennard scaling paper. Thirty years of free transistor gains begin.
- 1989Intel 486 puts an 8 KB L1 on the chip.
- 1995Wulf & McKee name the problem in "Hitting the Memory Wall".
- 2001Ho, Mai & Horowitz, "The Future of Wires".
- 2004–05Dennard scaling ends. Voltage stops falling, so wire energy stops falling.
- 2013The HBM standard: memory moves onto the package.
- 2022Stacked 3D V-Cache and FlashAttention: hardware stacks, algorithms count bytes.
- 2026HBM4 is in production at all three vendors; DRAM contract prices rise ~90% in one quarter.
Which specific physics compounded into the memory wall?Tue 8 Sep
Four walls stack on top of each other: the DRAM cell, the on-chip wire, the off-chip link, and the way memory is organized.
A cell needs a fixed charge to survive leakage, radiation and 64 ms of retention. Its wordline runs at ~3 V, about 16× the energy per unit of capacitance of a 0.75 V logic wire. The row cycle has been 45–50 ns since ~2005, and refresh takes 4.5–7% of the time.
Flat since voltage froze. Crossing a 20-mm die costs 30–60× an 8-bit MAC per bit. That is why every 2026 accelerator is a grid of small tiles, each with local SRAM.
Socket pins grew 321 → 7,529 (1995–2024) while transistors grew ~104×. Pads and packages add hundreds of fF to pF, and termination burns current even when idle.
Each activation opens an 8-Kbit row per chip just to get one 64-byte line. Of a ~90 ns miss, only about a third is the DRAM array itself. The rest is on-chip wire, coherence, queueing and the interface.
The closer the memory, the cheaper the bit
System energy per bit, log scale. Source: The Memory Wall report, Part V (O'Connor et al. 2017, vendor data).
The 15–20× gain from DDR3 to HBM3E came almost entirely from geometry, as the distance shrank from centimetres to millimetres. Transistor scaling contributed almost nothing.
What happens next? Projections to 2040Tue 8 Sep
Nothing in the physics reverses the trend. Energy per bit falls only where the wire gets shorter, and latency doesn't fall at all.
| Metric | 2026 | 2030 | 2035 |
|---|---|---|---|
| DRAM row cycle | 45–50 ns | 45–50 ns | 45–55 ns |
| Loaded latency, core → DDR | 80–110 ns | 80–110 ns | 70–110 ns |
| HBM bandwidth per stack | 2–3.3 TB/s | 4–6 TB/s | 8–16 TB/s |
| HBM energy per bit | ~2 pJ | 1–1.5 pJ | 0.3–0.8 pJ |
| On-chip wire, per bit·mm | 0.05–0.1 pJ | 0.05–0.1 pJ | 0.03–0.08 pJ |
| 8-bit MAC | ~0.03 pJ | ~0.015 pJ | ~0.008 pJ |
| Accelerator ridge (FLOP per byte) | ~1,000 | 1,500–2,500 | 3,000+ |
| Hierarchy tiers (server) | 8–10 | 9–11 | 9–12 |
DRAM hybrid-bonded straight onto logic (2029–35): 0.1–0.5 pJ/bit. This would be the first 10× gain since the move from DIMM to interposer.
Optical links: 1–3 pJ/bit, the same at any distance. Bandwidth per watt improves, but latency doesn't (≥100 ns).
CFETs may allow ~0.5–0.6 V, one last ~2× on wire energy. Cryogenics and steep-slope transistors remain speculative.
- Will not change: the 45–50 ns row cycle (it is physics), wire energy per mm at a fixed voltage, and the direction of the ratio.
- Baseline: bandwidth doubles per generation by widening and stacking, energy per bit halves every 4–5 years, and algorithms carry the rest.
- Upside: DRAM-on-logic arrives by ~2031, bringing ≥5× in energy and bandwidth. Downside: HBM keeps absorbing wafers, and memory gets rationed the way compute once was.
2 · Dally's numbers and your grid model
Tue 8 – Fri 11 Sep: turning the physics into a cost model you can score solutions with.
How do Bill Dally's CACM numbers tie back to capacitance?Tue 8 Sep · plus the mini-report justifying his heuristics
Every Dally number is a capacitance or an RC statement in disguise.
| Dally (implied) | The physics behind it | Your first grid (1 byte/node) |
|---|---|---|
| ~30 fJ per bit·mm | ½·c·V2, c = 0.2 fF/µm, V = 0.78 V, half the bits toggle | 125 fJ (4× Dally) |
| 2.5 mm/ns = c/120 | a repeated RC wire plus pipelining, not light (~c/2 on chip) | c/160 |
| 0.6 pJ + 0.3 ns endpoint | a sub-array's ~40 µm wordline and bitline, decode, sense | none (add it) |
| 2.6 B/µm², ~100 mm² | a 0.021 µm² cell × ~2.3 for periphery | 1 B/µm², 268 mm² |
| 256 MB access: 58 pJ, 12.3 ns | 30 mm of transport + the endpoint | 175 pJ, 11.7 ns |
- Your latency matched by coincidence: two ~0.73× factors cancelled. You charged the mean distance and he charged the far one, and your wire was 0.75× his speed.
- The velocity is a stable constant. Repeaters make delay linear in length (Bakoglu: T = 2.5·√(R₀C₀·rc)·L). r·c got worse and the repeaters got faster, so ~c/120 has held for 20 years.
- Mini-report: it rebuilds every figure in the article from six constants: c, r, V, the inverter time constant, SRAM density and off-chip link energy. It flags two inferences. His 15 mm is roughly an 88th-percentile distance, and his 230× only reproduces if the sub-array read and the add are counted on both sides.
What should my grid cost model charge: cell size, reads vs writes, a floor?Thu 10 Sep · five prompts, ending in the simplified-dally-model spec
32-bit words on a 1-µm grid at 1 fJ per word per µm is Dally's own constant, to within 4%. Reads pay the round trip, writes are posted, and a register-like floor fixes the near cells.
| Rule | Value | Why |
|---|---|---|
| Cell | 32-bit word, 1 µm hops | 4 B/µm²: dense for 5 nm, ordinary for 2-nm SRAM |
| Move | 1 fJ per word·µm; 0.4 ps per hop | = 31 fJ/bit·mm and c/120 |
| Read | 2 fJ and 0.8 ps per hop | request out + data back |
| Write | 2 fJ and 0.4 ps per hop | posted: no wait for an acknowledgment |
| Floor | 50 fJ / 50 ps read; 90 fJ write | a register-file access; cells within ~25–60 hops act like registers |
| Arithmetic | add 32 fJ; 16-bit MAC 0.2 pJ; FP32 FMA 1 pJ | your call: "all instructions touch data" |
| Tape I/O | not charged | fair only if every solution reads the whole tape |
| Score | energy to reach a test accuracy | area and time limits never bound, so they were dropped |
- "The memory wall is really a load wall." A load waits for the round trip; a store is posted and lets the core continue.
- Writes hide their real cost elsewhere: allocation (a write first reads the whole line) and invalidation of every other copy. In a coherent mesh, that control traffic is about a third of all messages.
- Why a floor: without one, the cells next to the processor were 16× cheaper than registers and 160× cheaper than SRAM. That biased every comparison toward many tiny nearby accesses.
- Coarser cells (32 bytes per node) save only ~1.5× per useful byte. The √-distance term is untouched.
What realistic area limits follow from Dally's Aha talk?Thu 10 Sep
At the talk's 100 fJ per bit·mm, every energy is a distance, and every distance squared is an area.
For the same energy you could move a bit this far
Log scale. Source: the 10 Sep answer, from the constants in Dally's Aha talk.
- The real die limit is energy, not the reticle. Beyond ~25–28 mm, a die spends more energy reaching its own edge than an HBM access costs: a 48 mm round trip ≈ 4.8 pJ/bit against 5 pJ/bit for HBM.
- Hierarchies come out geometric. Each tier is ~30× the area and ~10× the energy of the one below.
- 3D stacking is the only way past. A 50–100 µm vertical hop takes the ~10 pJ/bit end to end down to ~2 pJ/bit. That is the physics behind his "10× bandwidth" slide.
- Calibration note: the talk's 100 fJ/bit·mm includes routers and pipeline flops; the article's 30 is the bare wire. Don't double-count.
How should I price the input tape, and what scratchpad does MNIST need?Thu 10 Sep
Charge the off-chip crossing as a constant, ~10 pJ per bit, which is worth about 100,000 hops. MNIST needs about half a megabyte of model.
Every MNIST model fits in a few percent of one 1-mm² tile
Log scale; accuracy is after many passes. Source: the 10 Sep answer.
- The tape is 55 MB: 60,000 training images with labels, then 10,000 test images. A tape is single-pass, so anything seen twice must be kept in the scratchpad.
- The balance point is 0.25–0.5 MB of model, where reading parameters costs as much as streaming the data in. The MLP-128 sits right on it.
- Keeping the training set (1.5% of a die) makes extra epochs 44× cheaper than re-streaming. k-NN costs ~0.86 J, about 60× the MLP's entire run.
- Crossing costs by technology: die-to-die 0.3–1 pJ/bit, HBM 5, DDR 10, PCIe 8–15, and SSDs or networks ~100 pJ/bit.
How do I make the grid multicore and runnable on an A100, and how should tapes reach it at p = 128?Fri 11 Sep · spatial computer, Astra, the ribbon
Use a lattice of tiles with one processor each, and make the pitch p the only parameter. Feed the tapes from a ribbon along the bottom edge, the way real chips use their beachfront.
| Pitch p | A100 mapping | Physical PE that fits |
|---|---|---|
| 32 4 KB per tile | a warp per tile, words in registers | bit-serial or 8-bit only |
| 64 16 KB per tile | a warp per tile, shared memory | a small 32-bit core |
| 128 64 KB per tile | a block per tile, shared memory | 32-bit core + router, Cerebras-like |
- A processor per word isn't buildable. A minimal 32-bit core is ~1,000 µm², the area of 1,000 of your words. The "spatial computer" papers assume processors are free.
- p = 128 is the physically honest choice; p = 32 is the GPU-native one. Run it SPMD and bulk-synchronous: one kernel per round, with depth = the number of rounds.
- What the A100 can't show: every message between SMs goes through L2 at one flat cost, so distance beyond a tile is invisible. The traffic volume that crosses tiles does carry over, so algorithm rankings agree.
- Replace the time limit with leakage: charge static power for every powered tile (SRAM ~0.5 W per GB). Time then enters the score through physics.
3 · Chips: Esperanto, ridge points, KV cache, Jetson and Mojo
Sat 12 – Sun 13 Sep: the memory wall applied to real hardware.
What is the ET-SoC-1 platform (ex-Esperanto), and why did it lose?Sat 12 Sep · with the grid-model mapping
It is a 1,088-core RISC-V inference chip that bought a huge scratchpad (160 MB of SRAM) and a thin memory pipe (137 GB/s).
- Why it lost: ~1,000 ops per DRAM byte suits recommendation and CNN models that fit in SRAM. It is fatal for LLM decode, where a 7B int8 model tops out near 20 tokens/s per chip.
- Its real strength: models up to ~150 MB stay resident and run at batch 1 at full utilization (its on-chip ridge is ~63). The cores are general, so sparse and irregular work runs too.
- In grid terms: Esperanto bought a bigger scratchpad and a cheaper hop; Thor bought a wider ribbon and cheaper MACs. Which wins depends only on whether the working set fits.
- Three answers to the same physics: Esperanto lowered the voltage and kept everything programmable. NVIDIA kept the voltage high and won on precision and software. Apex (Hasan Unlu) freezes the transformer operators in silicon.
- For modelling: it is a two-level tile machine (shires at ~4 mm, minions at ~600 µm) with DRAM ribbons on the left and right edges. Its caches are not coherent.
How many FLOPs per byte do LLMs do, and which chips can keep up?Sat 12 Sep · four prompts, from Thor's ridge to real models
Decode runs at 1–70 FLOPs per byte, while every chip's ridge sits in the hundreds or thousands. Only prefill and diffusion steps saturate the hardware.
- The ridge = peak FLOPs ÷ DRAM bandwidth. Below it, the arithmetic units wait on memory.
- Correction you got that day: Thor's FP8 dense ridge is ~1,900, not 3,800. The 3,800 figure is FP4 dense or FP8 sparse.
- Saturating Thor takes reuse: ~1,900 tokens through each weight load (prefill, vision encoders, multi-camera batches). Decode can't get there; a 7B FP8 model runs ~39 tokens/s at 273 GB/s.
- Diffusion LMs turn decode into prefill-shaped work. They are faster at batch 1 but cost S× the FLOPs. They save energy only with few steps (~S < 25 for a 256-token block on HBM), and never when the weights already sit in SRAM.
Fact-check: did inference-only chips get the KV cache wrong? (500K context ≈ 50 GB?)Sat 12 Sep
Yes for the SRAM-centric chips. GPUs were caught too, but they could grow their DRAM. "50 GB at 500K tokens" fits an 8B GQA model; a dense 70B needs 160–180 GB.
- Why it broke the design point: weights are read once per step and shared across the batch. KV is per sequence and re-read every token, so at long context it sets both capacity and bandwidth.
- The 2019–21 chips were designed around BERT at 512 tokens (~19 MB of KV). A 500K context is 1,000–10,000× that, per sequence, and it can't be batched away.
- KV catches up with the weights at ~125K tokens for Llama-8B, ~440K for 70B, and ~10M for DeepSeek-V3. That last figure is MLA's real achievement.
- Every architecture since Llama-2 cuts KV: GQA (4–8×), MLA (~15×), local/global layers (5–20×), linear-attention hybrids (10–30×), FP8 or INT4 KV (2–4×).
- For your grid, this is a second tape: a per-sequence sweep of 24–500 KB per context token, sized by the user rather than the model.
Is my Esperanto summary right, and how do Jetson and Mojo compare?Sun 13 Sep · your last question
Your numbers all check out. The power argument was about fitting a PCIe slot, not the electricity bill. And Mojo isn't a device: it's Modular's language, which Qualcomm now owns.
Same TSMC N7: the A100 has 15× the memory bandwidth
Linear scale. Source: the 13 Sep answer.
- On power: Ditzel never argued electricity cost. A PCIe slot offers 75–120 W, so six low-voltage chips per slot beat one hot chip. Your ~10%-of-TCO point is right for GPUs.
- What changed by 2026: grid power now caps data-centre capacity, so perf per watt counts as capacity rather than opex. That only helps parts whose absolute throughput is competitive, and the ET-SoC-1's isn't. At the edge, power always mattered, which is where Ainekko took it.
- Mojo, as reported in the chat: Qualcomm closed its ~$3.9B purchase of Modular on 29 Jul 2026. Mojo 1.0 shipped on 11 Aug, and the compiler went open source (Apache 2.0) a week later. Chris Lattner is now Qualcomm's EVP for AI software.
On a phone, swipe the table sideways to see all four columns.
| ET-SoC-1 (2021) | A100 (2020) | Jetson AGX Thor (2025) | Mojo / MAX (2026) | |
|---|---|---|---|---|
| What it is | 1,088-core RISC-V inference chip, open-sourced | data-centre GPU | edge SoC: Blackwell GPU + 14 Arm cores | language + compiler + serving; not hardware |
| Compute | 139 TOPS INT8 | 624 TOPS INT8 | 517 TFLOPS FP8 dense | whatever the target is |
| Memory | 160 MB SRAM; 32 GB at 137 GB/s | 80 GB HBM2e at 2,039 GB/s | 128 GB at 273 GB/s | exposes the target's hierarchy |
| Power | ~20 W | 400 W | 40–130 W | — |
| Ridge (ops per DRAM byte) | ~1,000 | ~306 | ~1,900 FP8 | — |
| Programming | C/asm, custom vector ISA | CUDA | CUDA, TensorRT, JetPack 7 | Python-like, MLIR-based, CPU and GPU |
| Portability | one chip | NVIDIA only | NVIDIA only | NVIDIA, AMD, Apple, Trainium, TPU, Qualcomm |
| Best fit | models ≤150 MB in SRAM; irregular work | training, batched inference | robotics: vision near peak | portable kernels; a target for code generators |
| Main risk | starved past SRAM; software burden | cost, power | NVIDIA lock-in; decode capped by 273 GB/s | young ecosystem; roadmap set by Qualcomm |
Jetson (Thor)
- The whole NVIDIA stack works on day one, and the hardware ships at volume.
- 128 GB of unified memory holds models and KV caches no other edge part fits.
- Vision encoders run near peak.
- Decode is capped by 273 GB/s: a 7B FP4 model reaches ~70 tokens/s at best.
- The 40 W floor rules out battery-class products.
- The dependence on NVIDIA is total.
Mojo
- One language from CPU to GPU, with the memory hierarchy exposed.
- An open compiler with no vendor gate, plus Python interop.
- Runs across NVIDIA, AMD, Apple, Trainium, TPU and Qualcomm.
- It doesn't make hardware faster; its GPU model is still CUDA-shaped.
- Its ecosystem is a fraction of CUDA's, and the parity claims are Modular's own.
- There is no backend for a manycore RISC-V part like the ET-SoC-1.
Mojo takeaways for your project
- It's the practical alternative to emitting PTX. Generate Mojo from the grid compiler and the same code runs on A100/H100, AMD, Apple and Thor. It buys you vendors, not fidelity to the grid.
- The open compiler is the real change. An ET-SoC-1 backend is feasible in principle, but it would be a project, not a configuration.
- Its pitch is the memory wall in software: it moves work between bandwidth-rich and compute-rich parts, the same prefill/decode split as your ridge tables.
- Treat its parity claims as claims. Check the one number that matters to you, energy per token at fixed accuracy, on your A100.
- Ownership cuts both ways. A silicon vendor now sets the roadmap, which the Apache license partly offsets.
Where everything lives
- The chat (22 prompts, 8–13 Sep): claude.ai · public share
- The Memory Wall, the 60-year report it produced: tailnet · GitHub Pages
- Justifying Dally's Heuristics, the mini-report, now interactive and checked line by line against the essay: spacesheep · tailnet · GitHub Pages
- Your notes doc, "08sep26 – interlude show": Google Doc
- Gemini drilldowns, 8 Sep: chip interconnect scaling · DRAM scaling · capacitance scaling and the memory wall
- NotebookLM output: cinematic video · slide deck
- The grid model spec: cybertronai/simplified-dally-model
- ET-SoC-1 platform note (12 Sep): on the M5,
~/git/backprop-memorywall/et_platform_overview.md - What came next: Backprop versus the memory wall (12–13 Sep) · Sutro #32 talk brief (16 Sep)
- Not recovered: the files you attached are hidden in the share. These were Dally's Aha talk, the Esperanto background, and the 13 Sep "extra materials" with a screenshot. The answers above reference them.